
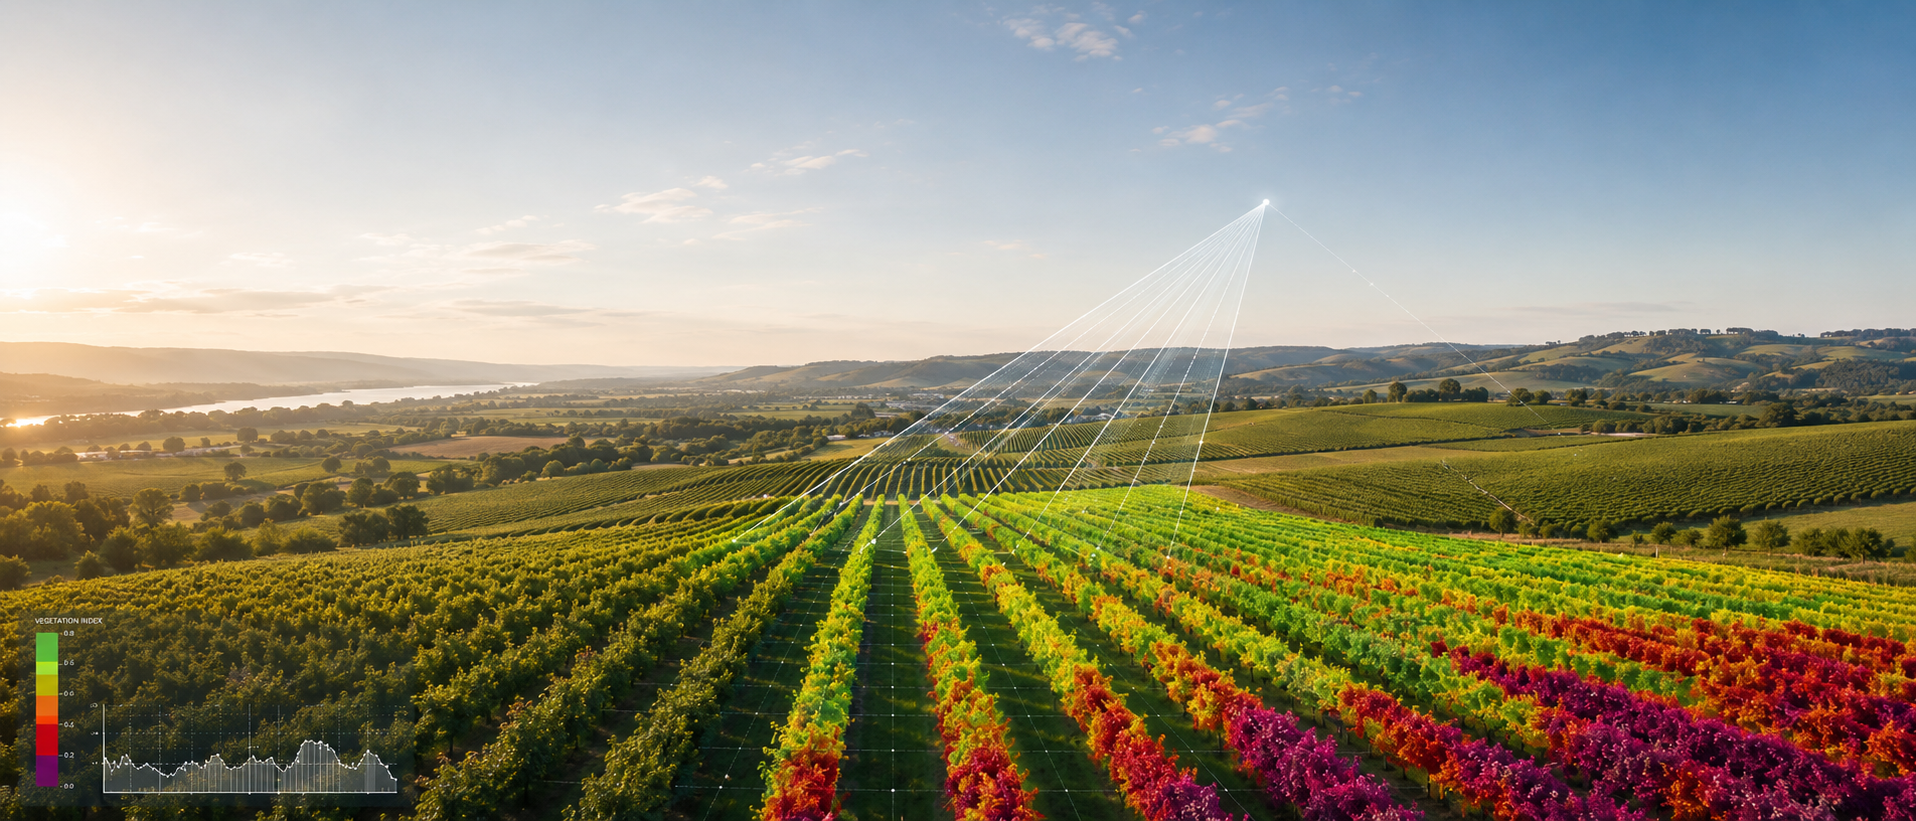
BETTER DATA. BETTER DECISIONS.
Geospatial analysis and high-resolution aerial mapping for specialty agriculture, engineering, construction, and land management.
Red Tail Analytics turns aerial imagery, remote sensing, and spatial data into practical information you can use in the field.
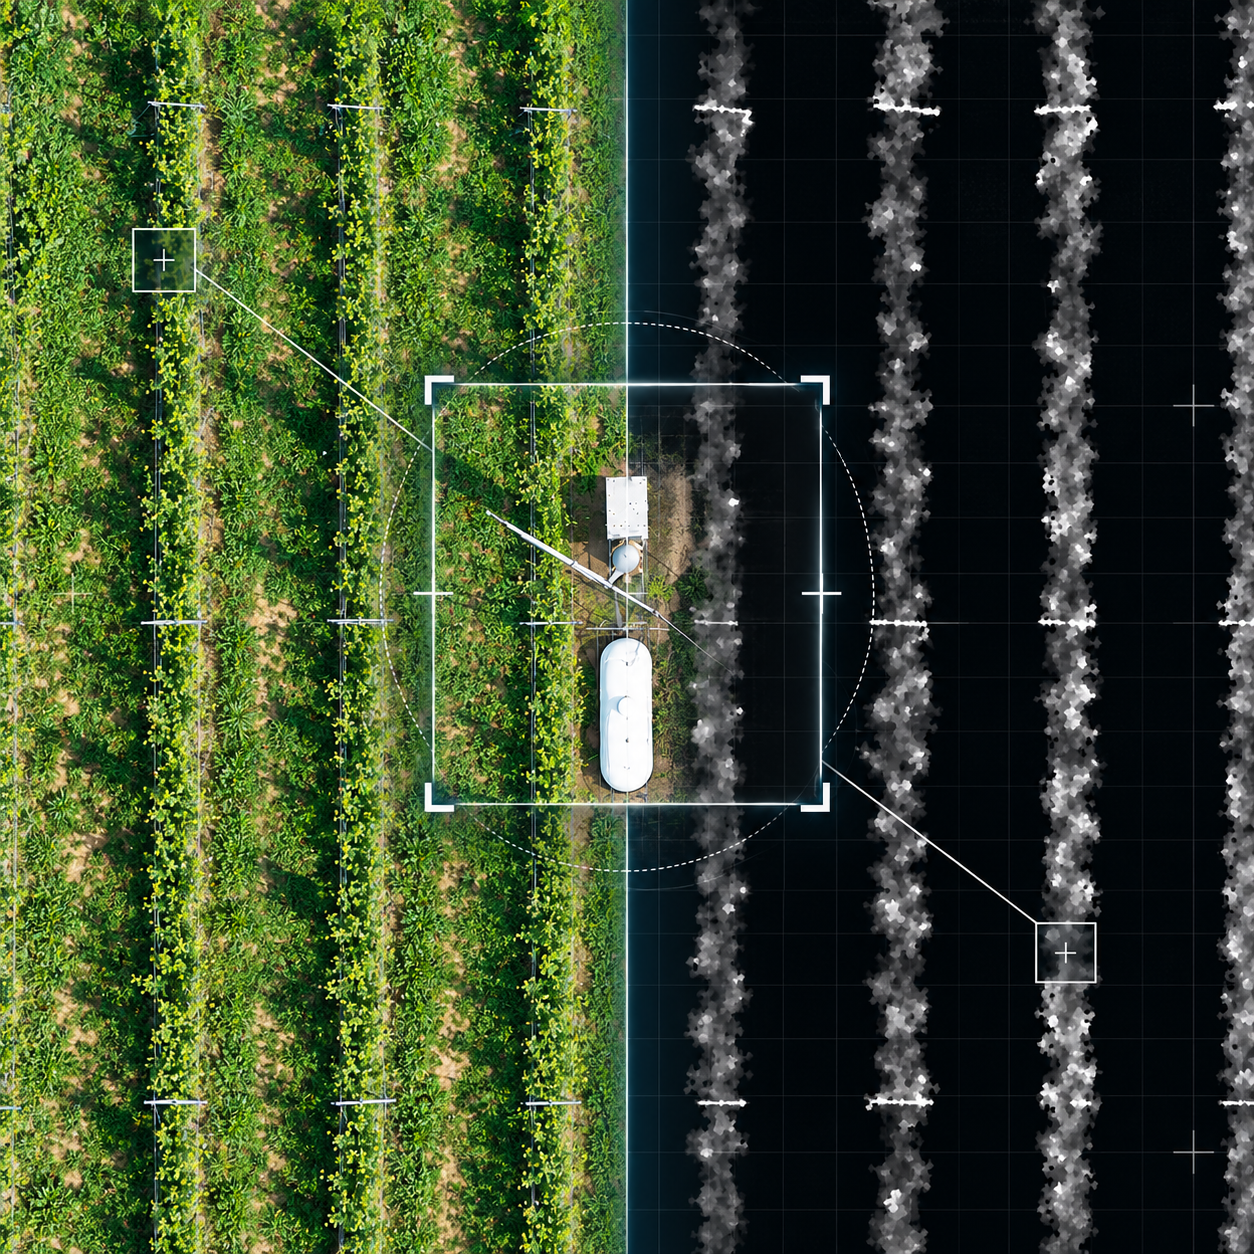
Data collection is only the starting point. Red Tail Analytics brings together aerial imagery, multispectral data, RTK/GNSS observations, terrain models, public LiDAR, and other spatial information to answer specific questions about the places you manage.
More than a drone flight
The result isn't simply another map or dataset. It's clear analysis that identifies patterns, highlights areas worth investigating, and helps focus time and resources where they matter.
-
High-resolution RGB and multispectral imagery collected using disciplined, survey-informed field methods. RTK/GNSS positioning, ground control, checkpoints, and consistent acquisition procedures help improve positional accuracy and make repeat observations more meaningful.
-
GIS, vegetation indices, canopy and terrain models, public LiDAR, photogrammetric surfaces, change detection, and spatial modeling.
-
Clear maps, inventories, scouting priorities, reports, and GIS-ready data built around the decisions you need to make.
Practical geospatial services built around the questions you need answered.
Red Tail Analytics combines aerial imagery, remote sensing, and GIS to create clear, useful information for agriculture, engineering, construction, and land management.
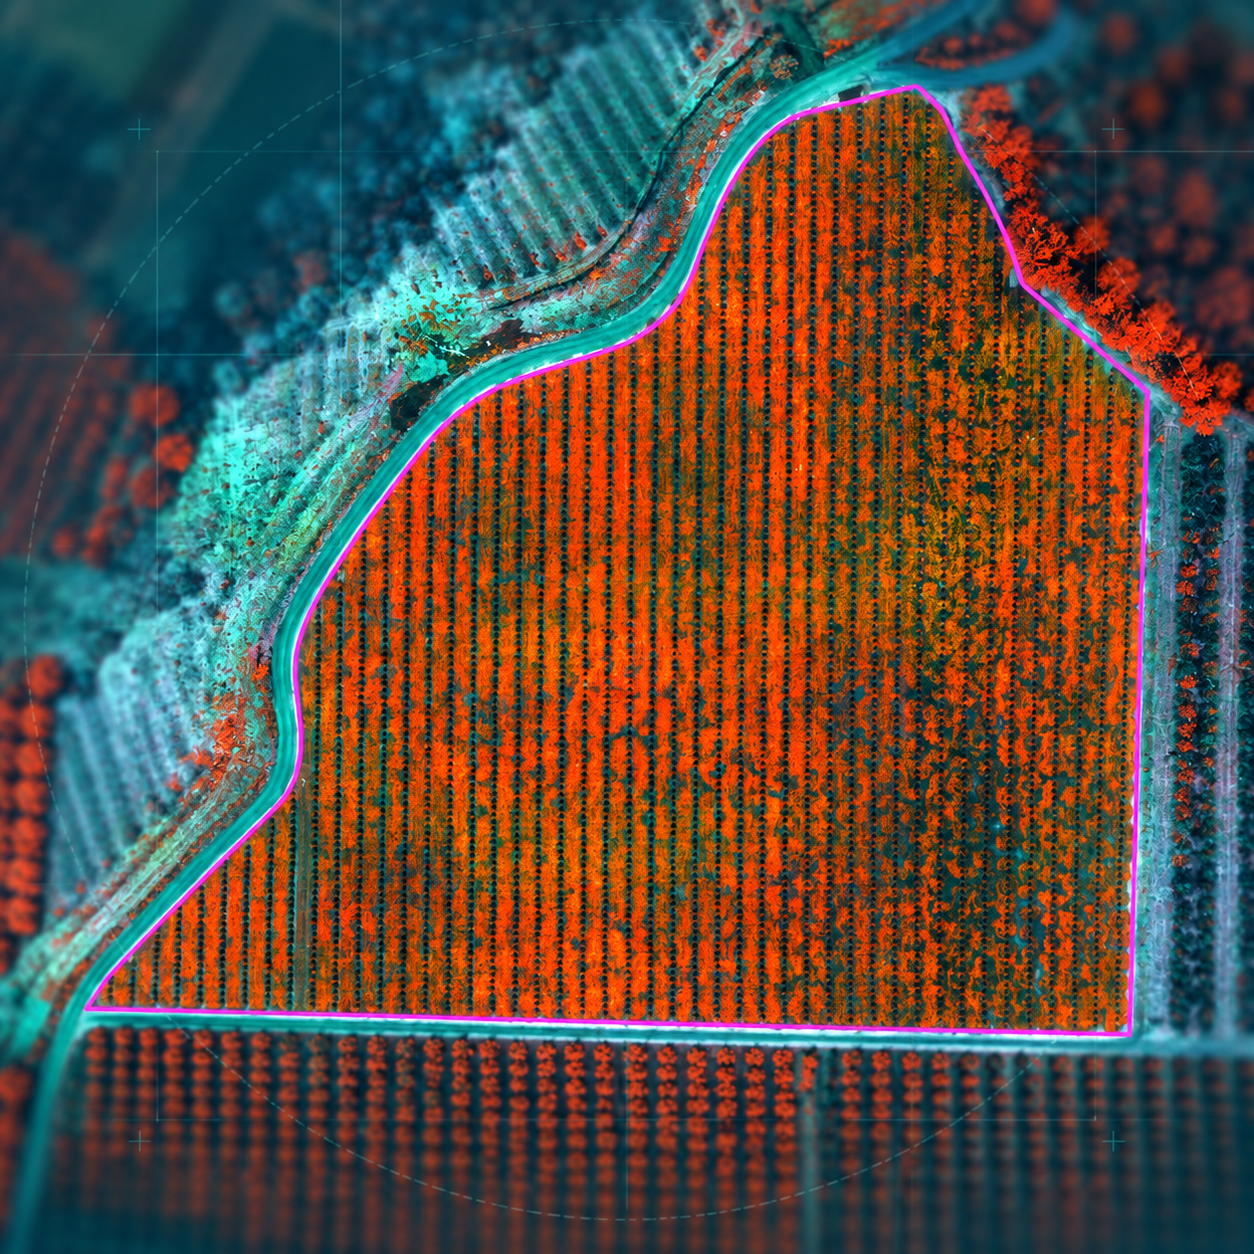
Agricultural Analytics
Crop-specific analysis for orchards and vineyards.
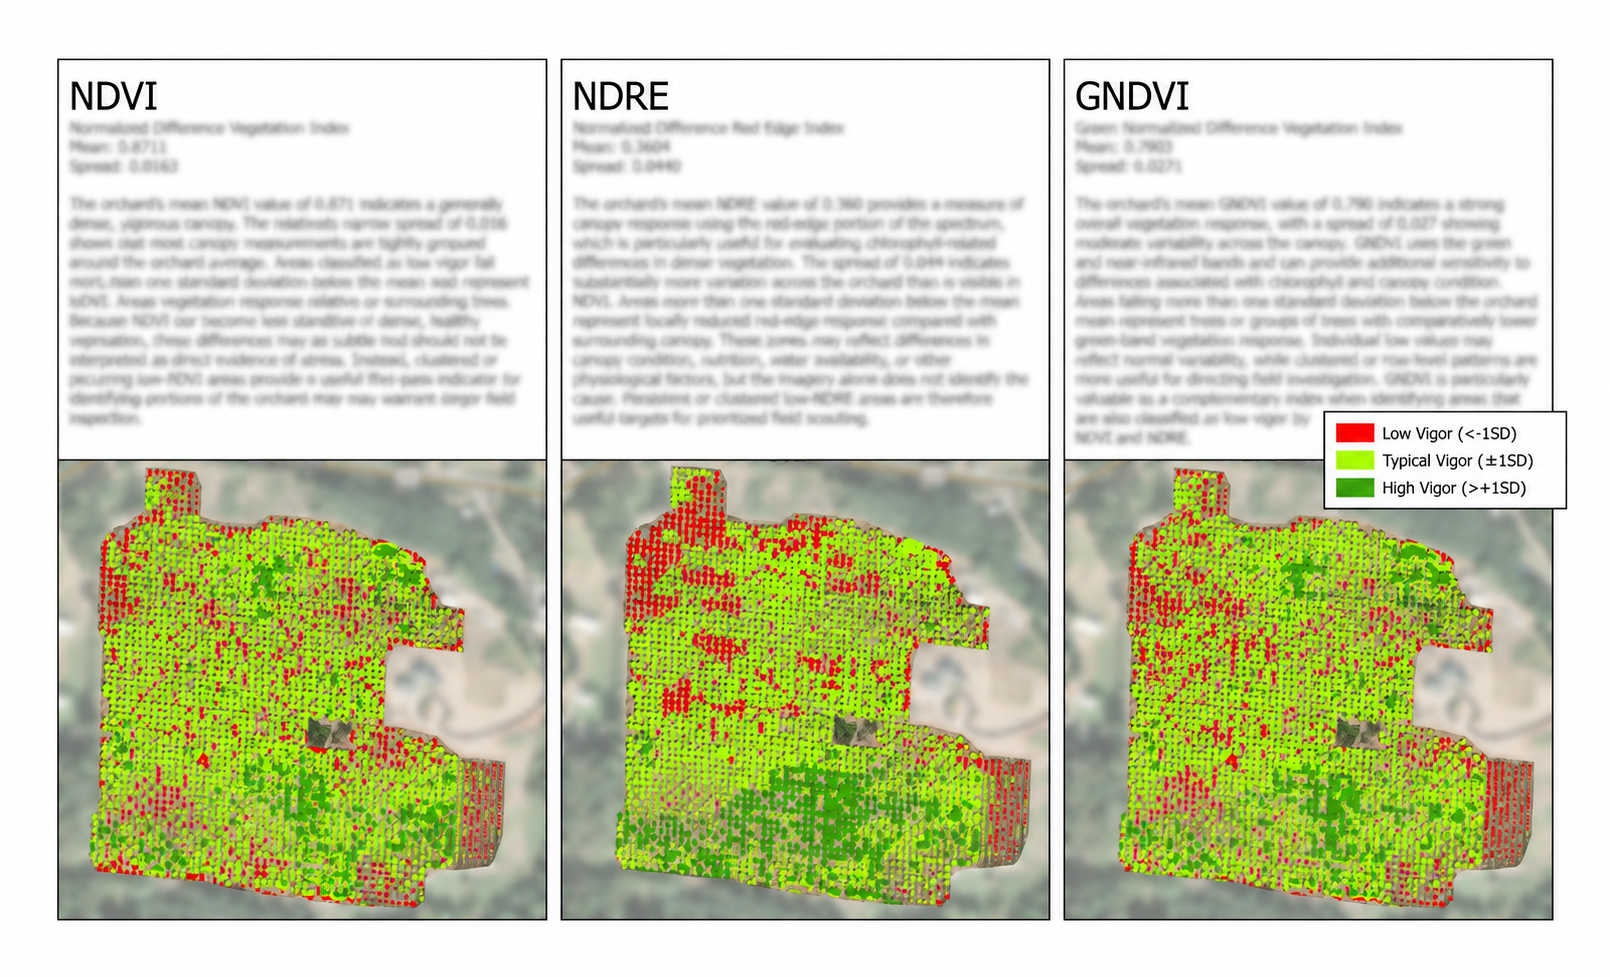
Turn high-resolution RGB, multispectral, canopy, and terrain data into practical information about crop condition and variability.
Typical applications
Orchard inventory and canopy-gap assessment
Missing or weak tree identification
Low-vigor and abnormal-canopy detection
Priority scouting zones
Multi-index vegetation assessment
Block variability and change detection
Terrain, drainage, and irrigation-pattern analysis
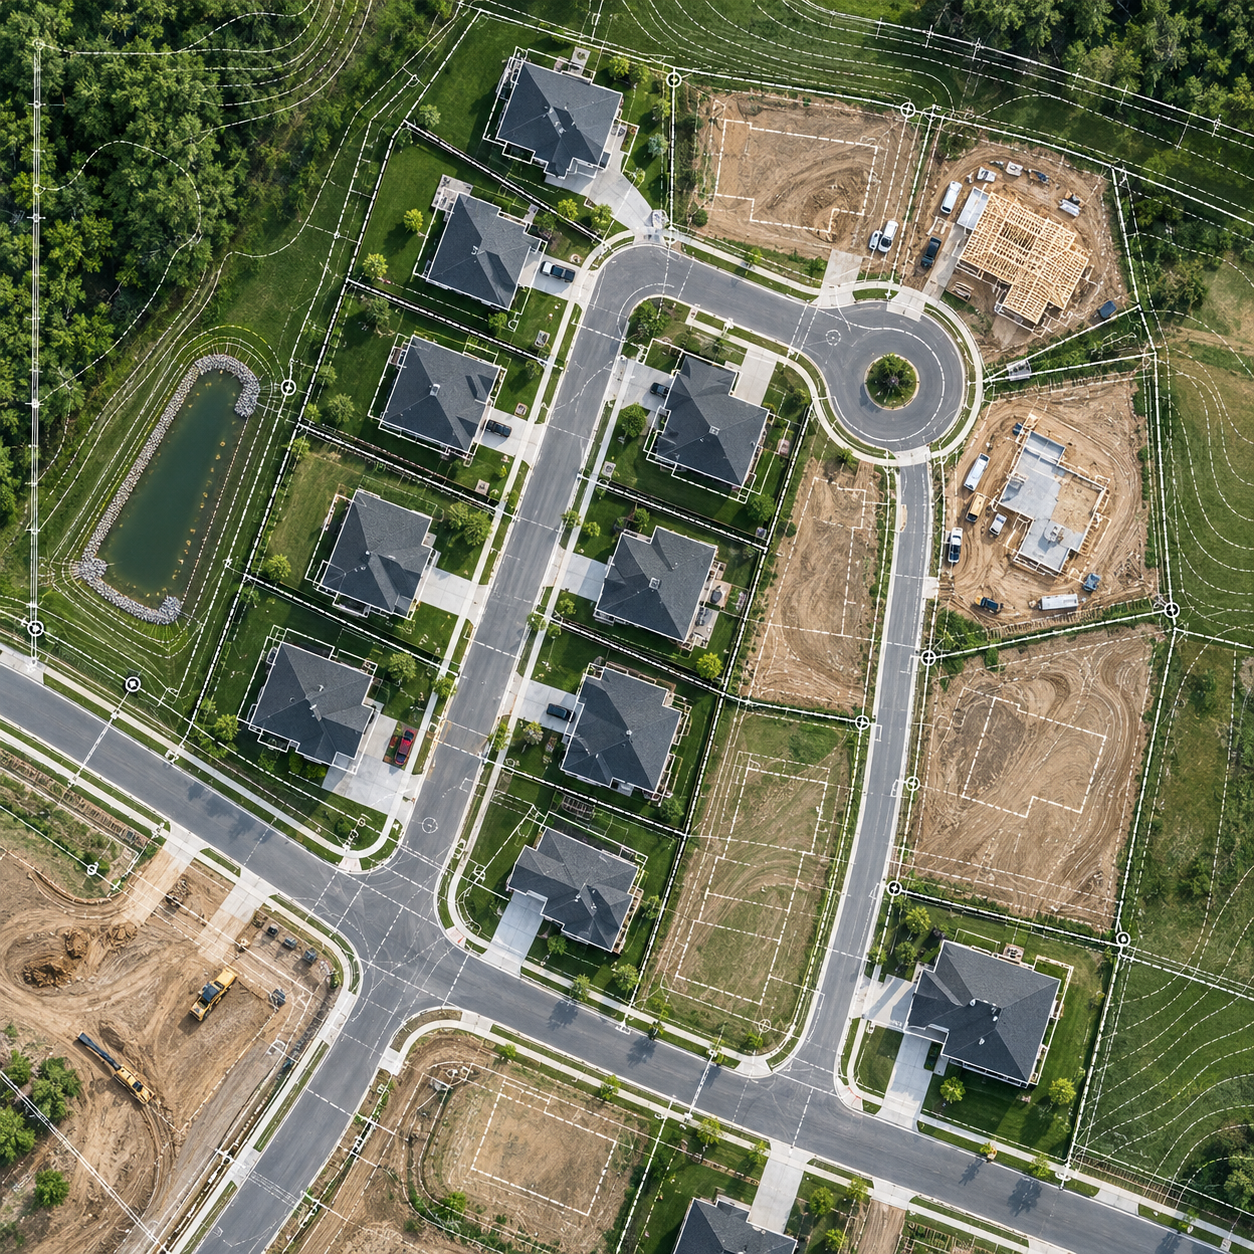
Aerial Mapping
Accuracy starts in the field.
Red Tail Analytics applies surveying-derived field practices to aerial data collection, including RTK/GNSS positioning, ground control, checkpoints, coordinate-system management, and repeatable flight procedures. The result is mapping designed not only to look accurate, but to support reliable measurements and meaningful comparison over time.
Typical applications
RGB orthomosaics
Existing-condition mapping
Construction progress documentation
Surface models
Elevation products
GIS-ready imagery
GIS & Spatial Analysis
Connect the data. Understand the site.
Red Tail Analytics combines aerial imagery with GIS, terrain data, public LiDAR, and other spatial datasets to reveal relationships that are difficult to see from a single source. The result is clearer analysis that supports planning, site evaluation, and decision-making.
Typical applications
Public LiDAR integration
Terrain and slope analysis
Hydrology and drainage
Elevation modeling
Property and land-use mapping
Custom spatial analysis
From imagery to actionable information
Red Tail Analytics combines high-resolution drone imagery, multispectral data, GIS, terrain models, and other spatial datasets to help clients better understand the places they manage.
We focus on turning complex geospatial data into clear maps, analysis, and field-ready information that supports better decisions.